Marc Chauvin

Mount Shuksan via The North Face, White Salmon, and NE Ridge

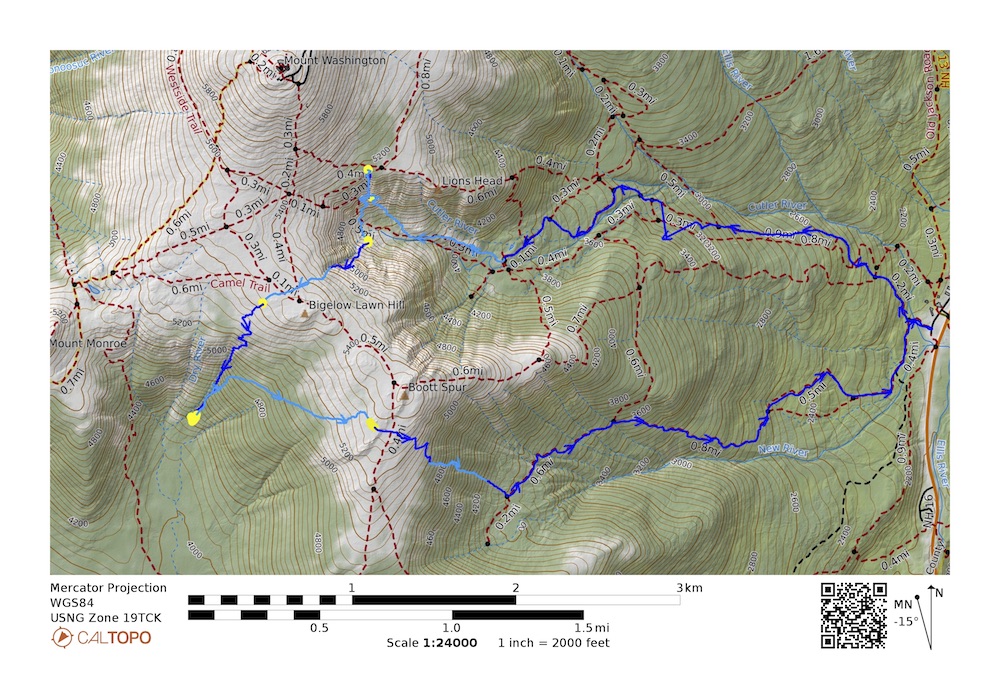
The North Face of Shuksan with the route of our ascent overlaid on Google Earth

On August 3, 4, 5, 2021 I got to climb the North Face of Shuksan via the Fisher Chimneys down the White Salmon Glacier up the North Face then up the Northeast Ridge of the Summit Pyramid. Our descent was via Hell’s Highway, Winnie’s Slide and Fisher Chimneys.  This was a three day trip and we were a party of four climbing in two rope teams. We bivied at the base of the North Face and at the base of the Summit Pyramid on the Sulfide Glacier. During the trip I ran a track each day and ran that data through the Track Parser App I have developed. You can use the Track Parser for free here Track Parser App

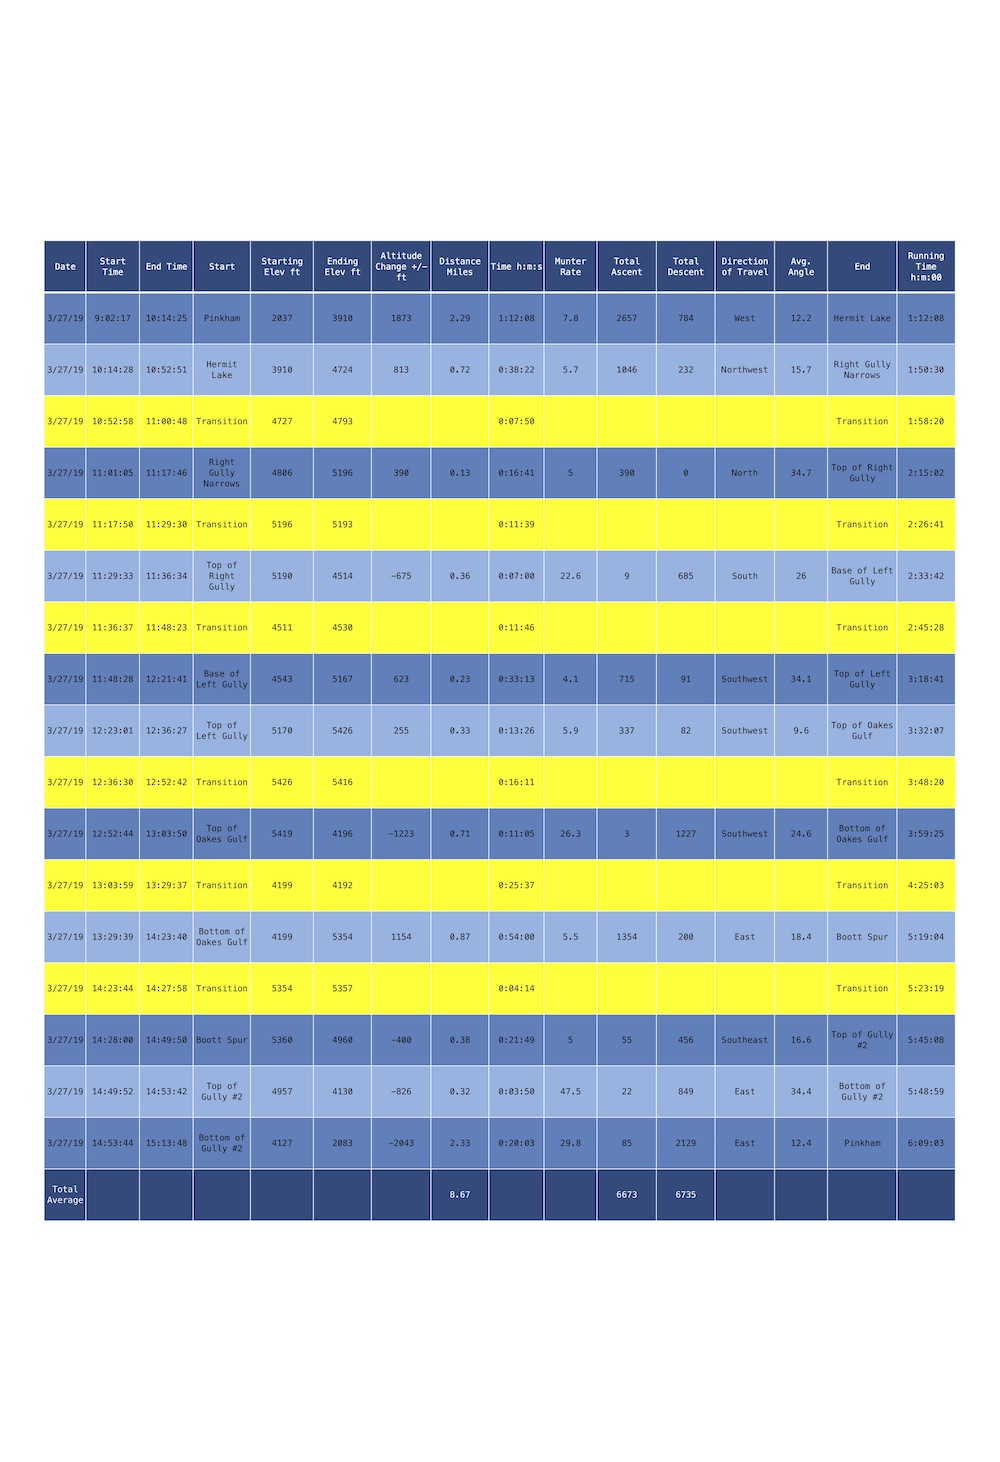
The Track Parser gives you 4 data files: A .csv file, an .html file, a .geojson file, and an .xlxs file. The .html file gives you an interactive mph map that is very useful for mountain bikers, skiers, and runners but not very useful for alpine climbs so it has not been included here. The .csv is only useful for those who can manipulate that data and if you can do that you can get the .csv data from the .xlxs file albeit with one more step, so for simplicity and less confusion I have not included it.

What I have included for each day is the Geojson file that when uploaded into Caltopo you get an interactive map with each leg color coded in sync with the row colors of the .xlxs file, a .kml file that will open in Google Earth and give you the data as well in that program. I have also included links to already built Caltopo maps with the data but they are “read” only, though you can export the data from them. There is also the Excel files (.xlxs file) and an overview Geopdf map that will import into Avenza.

I hope you enjoy the data and find it useful.

Click the photo or the link below for the Geopdf

Overview Geopdf 

Day 1 Data

Day 1 Shuksan KML
Day 1 Shuksan Geojson
Day 1 xlxs
Caltopo Read Only Map Day 1 
https://caltopo.com/m/D4A5N

Day 2 Data

Day 2 Shuksan KML
Day 2 Shuksan Geojson
Day 2 xlxs
Caltopo Read Only Map Day 2 
https://caltopo.com/m/0H4DT

Day 3 Data

Day 3 Shuksan KML
Day 3 Shuksan Geojson
Day 3 xlxs
Caltopo Read Only Map Day 3 
https://caltopo.com/m/0JBDU


Posted by Marc Chauvin in Maps, Mountain Biking

Three Ravine Tour: Skiing in Tuckerman Ravine, Oakes Gulf, and Gulf of Slides

Click on the map to download large geopdf

I was going through some old tracks and found a track from a trip I did in March 2019. This is a pretty classic tour for me to do. The day I did this tour the avalanche hazard was low. You can see the archived forecast for the day here. The day ended up warmer than forecasted with temperatures getting above freezing at the altitude of the ravines, you can get that info from the next days forecast here.

Click on the picture to download the data

Because of the program I developed I was able to reverse engineer the route plan with the actual times and other data. On this tour I wasn’t going for a record time, it was just a good solid pace with a few breaks as you’ll see in the data. I say this so you can calibrate the information for your pace and adjust as you see fit, either planning a faster or slower pace.

The map and the data are color coded so that you can visualize each leg. The yellow areas are the transitions. Below you will find the GPS track as a .gpx file and .kml, the data as a .csv. For the map and a PDF of the data just click the photos or there are also links below.

3-27-19 GeoPDF Map
3-27-19 Data
3-27-19 csv
3-27-19 kml
3-27-19 gpx (Some browsers add a .xml extension, delete the .xml leaving only the .gpx extension before saving)

Posted by Marc Chauvin in Maps, Mountain Biking

Moab MTB, Whole Enchilada and Slickrock

Click to get Geo-PDF Map

On October 14 and 15, 2020 I got to ride two of Moab’s classic trails The Whole Enchilada and Slickrock. I found these trails very different from each other and unique compared to trails I have ridden in other areas.. The WE was a long trail/ride that went from over 11,000 feet to the Colorado River at around 4000 feet so it rode through a variety of climatic zones. Slickrock on the other hand was all on sandstone with very little vegetation.

The WE was a long ride, about 27 miles but I got dropped off 2.5 miles from the trailhead on Geyser Pass Road and rode the 3 miles from the endpoint at Grandstaff Campground to Lion’s Park in Moab adding over 5 miles to the ride.

Click for a PDF of the data

I found the WE to be a good ride but anything that long can’t be fantastic the whole way.  My favorite parts were in the top half,  from the trailhead to the crossing of the LaSal Loop Road. The climb to Burro Pass was really good and I was able to ride most of it. As I got to the pass there was a group hanging out and all I saw was the trail going up Manns Peak. You’ll notice that I went up a bit that way and figured out I blew the navigation.

The descent from the pass reminded me of home a bit. The best part of the decent though was the Hazard County Trail. The up was short but sweet and the down was fast and with good flow that I appreciated since the area is so dry it makes things a bit slippery.

The second half was more desert like and good but not my particular favorite but it was as expected. I will say that when looked at as an entire ride it is an awesome link up that I am really glad I got to do.

I rode the Slickrock Trail the next day. I didn’t know there was a fee to get into the county park it is located in so I am mentioning it here, it was $5.00 for the day so it isn’t expensive.

Click to get Geo-PDF Map

I found out after the fact that the recommended way to ride it is clockwise but I had ridden it counterclockwise. Honestly it seemed like they would be about the same. This was a fun quick ride that I enjoyed. It is very different from what I am use to and the friction of the tires on the rock allowed you to climb nice steep hills which was cool. I will say though that riding this trails wouldn’t prepare you really for the WE, to me they seemed very different in style and flavor.

Click for a PDF of the data

You can click the maps and data above to get a PDF of those. Below are links for those and the GPX and KML files as well. I hope you find this info useful.

WE Map
WE Data
Slickrock Map
Slickrock Data
WE gpx (Some browsers add a .xml extension, delete the .xml leaving only the .gpx extension before saving)
WE kml
Slickrock gpx (Some browsers add a .xml extension, delete the .xml leaving only the .gpx extension before saving)
Slickrock kml

Posted by Marc Chauvin in Maps, Mountain Biking

West Side NoCo Mountain Bike Ride

On June 22, 2020 I had an appointment to get my car fixed so I planned a bike ride from the garage. I wanted it to take a good portion of the day so I wouldn’t have to wait for the car to get fixed. What I ended up with is a 25.13 mile ride with 3.01 miles being on pavement, 3.36 miles on gravel rd and 18.73 miles of single track.  I was trying to do as much single track as possible but I was also trying to avoid repeating sections of trail. I didn’t work very hard to plan a route since I knew the area pretty well so I might have done a little better with more precise planning. I ended up repeating about 2.2 miles of single track (mostly the trail Lager in the Marshall Conservation Area) and .37 miles of gravel road. I worked out these stats to give you an idea of how extensive the trails are in the Mount Washington Valley. Considering this is only one side of the valley and the other side (East) has as many or more trails and is arguably more popular you can see there is a lot of riding here. There was virtually no sections that I had to hike my bike (no more than 20-50 feet) and arguably any walking I did speaks more to my skill or fatigue than the trail. I will say that the direction of travel is important as far as the amount of walking you do, particularly the climb and descent of Whitehorse and Cathedral.

Here is some of the details with a map. I broke up the trip into legs with times and other data. I also color coded the map and the data so that the black is paved, the brown is gravel, and the bright blue and light blue are single track. The color coding is both on the map and the data. I have also included a .gpx file and .kml file for you if you want to put either of them into a mapping program.

West Side Data
West Side Map (This is a Geopdf)
West Side .gpx File (Some browsers add a .xml extension, delete the .xml leaving only the .gpx extension before saving)
West Side .kml File

Posted by Marc Chauvin in Maps, Mountain Biking

Mountain Biking -–––> Mapping -––––> Python

In the last two months I started to learn how to write Python code. For me to learn I needed to simultaneously take an online course and work on a project that motivates me. When I started working on this I figured I might get something done in 6-8 months. Fortunately I wrote a program that is very useable for me. The Python journey started because of maps and maps got started because of climbing, skiing and mountain biking.

The other day I did a fun ride over in the Black Cap area here in North Conway. The ride I did was up Hurricane Mountain Rd, onto the Black Cap Trail to the Cranmore connector, down the Hurricane Trail to the Red Tail, up the Red Tail back to the connector, down the connector to Kandagnar,  down that and back to the start. 

I ran a track while I went on my ride and when I got home I used my new program to break it up into legs. The program allows me to break it up anyway I would like and then it gives me data like speed, time, Munter pace, elevation gain and loss, along with other data. That is the function of the program is that after the fact I can get data for any section. Here is how it come out of the program .txt file . Below is a cleaned up version that took me a few minutes in Word to make it more readable.

Click here the map for a geopdf map.                                                                                                                                                     Click here for the .pdf trip plan

Posted by Marc Chauvin in Maps, Mountain Biking

Mount Washington Climbs and Ski Runs

First a disclaimer: The info is the best I know but all data should be considered suspect until you have field verification.

Here is a Geopdf map, with GPX, KML, and a GeoJSON data files along with a KMZ file that will put the map onto Google Earth to download of the runs and gully climbs on Mount Washington. It includes Huntington and Tuckerman Ravine, Gulf of Slides, Oakes Gulf, Monroe Brook and Ammonoosuc Ravine. I have left out the runs and climb of the Great Gulf because I am not familiar with the names of the gullies there. Once I get that sorted out I will include those in the future.

The Geopdf can be imported into the Avenza app on your phone to provide you with a GPS enable map. The GPX and the  KML data can be used in a wide variety of programs with the KML importing only the lines and markers into Google Earth. The GeoJSON file is for those that use CalTopo so that the lines and markers better import into that program.

Before skiing, riding, climbing or recreating in avalanche terrain you should get the weather and avalanche forecast at a minimum.

Here is the URL for the Geopdf

http://www.chauvinguides.com/wp-content/uploads/2020/01/climbrun.pdf

Here are the data files:

GPX (Some browsers add a .xml extension, delete the .xml leaving only the .gpx extension before saving)
KML (Once downloaded click on the file and it will overlay the lines onto Google Earth)
GeoJSON (Some browsers add a .txt extension, delete the .txt leaving only the .json extension before saving)
KMZ (Once downloaded click on the file and it will overlay the map onto Google Earth)

Posted by Marc Chauvin in Mountain Biking

Red Rock Canyon Painted Bowl Descent

November 17, 2019

I have done the Painted Bowl descent numerous times both from the top of Solar Slab and Black Orpheus but I never did a GPS track of it. Yesterday I climbed Solar Slab with a friend and tracked the descent. For the most part it is pretty easy to find, particularly the the beginning where you have to locate the start of the rappel into the bowl, not because it is obvious but there are quite a few cairns. Of course in fading light or if the cairns get removed the track maybe very helpful. Regardless I figured I would publish the track and a geopdf map for anyone who would like it.
Here is the the track both as a .gpx and .kml
Painted Bowl Descent GPX (Some browsers add a .xml extension, delete the .xml leaving only the .gpx extension before saving)
Painted Bowl Descent KML
Click the photo below for the GeoPDF. The black line is an approximation of a route described in the Handren Guide, the blue line is the route I travelled.

Posted by Marc Chauvin in Mountain Biking

Personalized Visualization of an Avalanche Forecast

October 26, 2018

Avalanche forecasts currently come with some specificity through the use of “Avalanche Problems”, we now get:

  • Avalanche Character
  • Location
  • Likelihood
  • Size

This methodology for forecasting allows the user to better understand the information the forecaster is trying to communicate. If you are unfamiliar with this style of forecast this short video is a great resource, Avalanche Problems Explained by the National Avalanche Center.

Once you understand the 4 avalanche problems the next step is to plan your trip and travel through the mountains avoiding the hazard as much as possible or mitigating it by choosing low consequence terrain when getting into the suspect areas. The goal is to visualize where the problems are and act accordingly. Since we are talking about terrain it seems reasonable to map the hazard based on the forecast. Fortunately we live in a time where GIS technology allows each one of us to do that and build it in a way that is personally intuitive. Here is a video on how to do just that, once you watch scroll past the video for a bit more info.

Please place your YouTube settings to HD

IMPORTANT: This will map start zones that are forecasted. You can still be exposed to the hazard if you are in the runout. The “size” element of the forecast cannot be taken into consideration with currently available slope shading techniques. Also, you may trigger an avalanche remotely from lower angle terrain or lower angled adjacent slopes may get pulled out during an avalanche. The overall hazard (Low, Moderate, Considerable, High, and Extreme) gives you insight as to the likelihood of those situations. 

Now that you’ve watched the video I have a more complete map that I made from the mock forecast in the video. What I did was added color to steeper terrain, so the persistent slab aspect and elevation between 43- 55 degrees is purple and the wind slab aspect and elevation between 43-55 is light blue. Also for those that want to see where the “generally safe” slopes are I colorized all aspects and elevations between 0-29 degrees bright green. The power of this is that you can colorize the slopes as you see fit and in a way that is intuitive for you.

Here is the map key, it is also on the SW corner of the map.


Click the thumbnail of the map to open up a high resolution image of it in a new tab.

Posted by Marc Chauvin in Mountain Biking

South Sister Prouty Glacier

May 14, 2018

Had a chance to go to Oregon for some work and had an extra day, fortunately it was spectacular weather. My friend in Bend OR wanted to ski the Prouty Glacier on the South Sister. The trail head is about 30 minutes from Bend. From the trail head the route climbs just under 5000 feet to the summit. From there we skied the Prouty Glacier side of the mountain down to Green Lake. To return to our car we then had to circumnavigate about 1/4 of the mountain to rejoin our uptrack about 1200 feet above the car.

Here are two maps a slope angle shaded (key is in the NE corner) and a regular topo. Both are Geopdf’s that will go into the Avenza App
Slope Shaded Map 
Topo Map

Here is the the track both as a .gpx and .kml
South Sister GPX (Some browsers add a .xml extension, delete the .xml leaving only the .gpx extension before saving)
KML

Here is a video and some photos of the tour.

Posted by Marc Chauvin in Mountain Biking

Ski Touring in Iceland’s Troll Peninsula

In April 2018 I went to Iceland with Andy to ski tour. The touring in Iceland’s Troll Peninsula is logistically simple in that tours start right from the road, there are no trees to obscure routes, and the mountains are below 4000 feet with tours starting from virtually sea level. In the 9 days we were in the Troll we toured 7 days, taking 2 weather/rest days.

Below you’ll find a little video of the trip, the .GPX and .KML file of our tours, and links to Geopdf’ maps of the tours. There are two maps; one is just a topo map the other is slope angle shaded so you can better see slope steepness for planning and avalanche terrain identification. The key to the slope shade colors is in the NE corner of the slope shade map. Since the maps are Geopdf’s they will sync with your phone’s GPS with the Avenza app. You can get them into Avenza with the QR code on the bottom right corner of the map sheet. Here are the links:

Iceland GPX (Some browsers add a .xml extension, delete the .xml leaving only the .gpx extension before saving)
.KML File
Geopdf Topo Map
Geopdf Slope Shaded Map

Enjoy the video remember to put your settings on HD!


Posted by Marc Chauvin in Mountain Biking